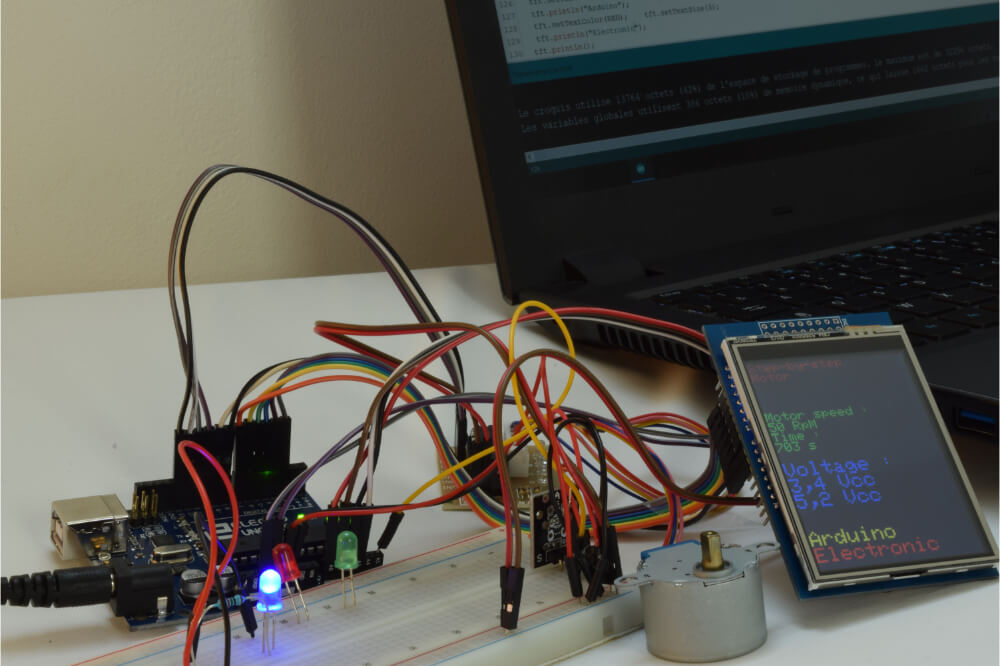
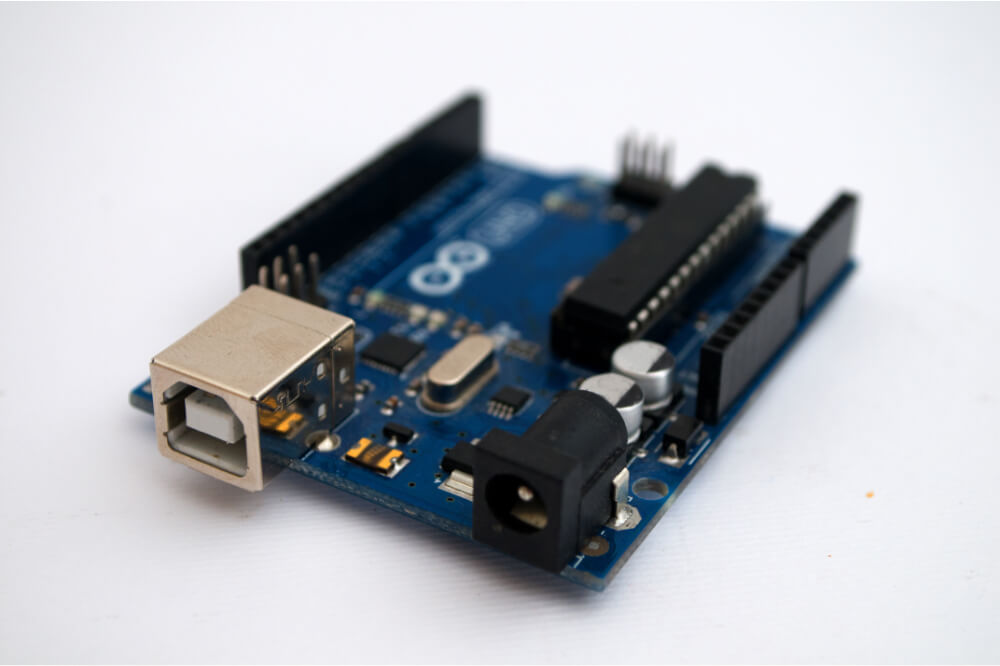
The Arduino serial plotter is a handy utility tool within the integrated data environment (IDE). The idea behind its development was driven by a need for programmers to visualize and conceptualize data.
Rather than merely displaying raw data values, the Arduino serial plotter graphs it on a moving line chart. The serial plotter achieves this by capturing serials over a USB connection and then plots them against an X/Y axis.
Additionally, the vertical Y-axis automatically adjusts as the output value decreases or increases. Typically, communication between the USB and Arduino is done via cabling.
Data Logging
The Arduino serial plotter allows users to graph data natively and do so in real-time. As a bonus, this serial plotter allows offline tasks such as troubleshooting of code without the need for expensive third-party services.
There are a few handy ways to collect and save data from any sensor connected to an Arduino. If, for example, you’re connected to a PC, you can serially convey the data from the Arduino to your computer and then save it to a file.
If you happen to have a micro-controller with an SD card attachment, you can load the data to the card. Alternatively, the Arduino allows you to connect to an online server and save all your data with ease.
Key Requirements
As you begin to get the hang of your Arduino serial plotter, there are a couple of things to note. A basic understanding of Arduino code is necessary to enjoy the full benefits successfully.
You will also require a reasonable grasp of electrical, HTTP requests, and serial communication concepts. Working knowledge on the procedure to install libraries in Arduino will also help understand how to save Arduino serial plotter data.
Armed with the necessary know-how, you will then need the following to set up your Arduino:
- Arduino IDE 1.0 or later
- DHT sensor library
- Data logging examples
- Spreadsheet; (Excel or Open Office)
- A 10-kilohm resistor
- Computer
- Ethernet Arduino and USB-to-serial connector
- Micro SD card
- Temperature and humidity sensor
Getting your Arduino Going
To get started, we must first install the Arduino IDE and then download the DHT library. Once the download is complete, unzip the library and change the directory name to DHT. Next, we locate the Arduino sketch directory and then copy the libraries into it.
By default, the location of the Arduino sketch directory is in your user directory, usually under the same name. Please note that you may have to create the libraries directory right within the sketches one. Before starting the Arduino IDE, download example sketches from a repository and save those to the sketch directory.
Notable Features and Applications
The use and functionality of the Arduino are noteworthy. Never before has raw data display been so graphic and straightforward. The graphing feature of the Arduino Serial Plotter lets you quickly observe relative changes in your data without looking at a stream of numerical values.
The Arduino serial plotter can report on a wide range of values in partnership with the attached sensors. Analog sensors, in particular, are an excellent pick for the Arduino as they can process more comprehensive value ranges.
Here are nine Arduino serial plotter highlights we feel are worth special mention:
- Multiple graph plotting
- offline functionality
- Automatic graph resizing
- Negative value graph support
- X-axis auto-scrolling
- Variable color coding
- Code troubleshooting
- Offline data visualization
- Waveform analysis
Setting up the Sensor
Due to certain issues, we can only provide you links to the code and cannot reproduce them here. But this is going to be your most difficult step and getting the code right will make your project.
Because the DHT11 sensor consumes minimal current, you can use the number five and eight output pins of a microcontroller to sufficiently power it. We can now attach the sensor to pin seven of the same microcontroller connected to the pins mentioned above.
As an added measure, remember to configure a pull-up resistor to your sensor set up to allow for spiking during zero transmission. Connecting your 10-kilohm resistor from pin 8 to pin 7, or the +5V pin should do the trick.
Simply put, the configuration is as follows.’
- VCC (pin 1) – Digital pin 8
- Output (pin 2) – Digital pin 7
- 4 Ground pins – Digital pin 5
Data Capture

As previously mentioned, there are a few ways through which you can save Arduino serial plotter data. The simplest and most straightforward way is using a computer to print and capture the results serially.
Here, we will look at four primary and practical methods on how to save Arduino serial plotter data:
Serial Data Capture to a Graph Using Your PC
For this particular data capture method, you will need to attach Arduino via a USB-to-serial connection. A humidity reader can then use the DHT library to take the sensor readings and transmit the results directly to your PC.
To upload the sketch to your board, you connect it to the computer via USB-to-serial and locate the board type in the Tools > Board menu.
Once the results transmit, you can then easily download and copy them into a new window in the Arduino IDE.
Using a Micro SD Card
You may need to save your data when you are not connected to a PC in some instances. Arduino’s Ethernet has the SD card right on the mainboard, making the attachment very easy. First, you will initially need to format a Micro SD card on your computer, and then load it on to your Arduino.
Next, you upload the SD card datalogger sketch, record the sensor readings using the DHT library, and save the DATALOG.CSV file results.
Data Capture to a File
Using a serial terminal program on your computer, you can capture serial plotter data to a file. To do so, open your program of choice, select a serial port from the options menu, and click the connect icon.
This icon will bring up the connection menu from which you then capture to a text file, name the file you create, and save. To discontinue the capture, you select connect > capture text file and use the stop promptly.
Cloud Saving
If your Arduino is connected to the internet via Ethernet, you can connect to a cloud or data management service and post your data at the click of a button. In addition to data storage, a great service provider will have graphing tools to allow data visualization.
Final Thoughts
Our verdict on the Arduino is that it is a great utility tool. With improvements and additional features lined up, this serial plotter can only get better.


